The Impervious Cover Model
* For updated information on how impervious cover impacts aquatic systems, you might want to check out Impacts of Impervious Cover on Aquatic Systems, available from the Center for Watershed Protection at http://www.cwp.org.Stream research generally indicates that certain zones of stream quality exist, most notably at about 10% impervious cover, where sensitive stream elements are lost from the system. A second threshold appears to exist at around 25 to 30% impervious cover, where most indicators of stream quality consistently shift to a poor condition (e.g., diminished aquatic diversity, water quality, and habitat scores). Table 1 reviews the key findings of recent research regarding the impacts of urbanization on aquatic systems.
| Table
1. Review of Key Findings of Recent Research Examining the
Relationship of Urbanization on Aquatic Systems |
||||
| Watershed Indicator | Key Finding | Reference | Year | Location |
| Aquatic insects | Negative relationship between number of insect species and urbanization in 21 streams. | Benke, et al. | 1981 | Atlanta |
| Aquatic habitat | There is a decrease in the quantity of large woody debris (LWD) found in urban streams at around 10% impervious cover. | Booth, et al. | 1996 | Washington |
| Fish, habitat & channel stability | Channel stability and fish habitat quality declined rapidly after 10% impervious area. | Booth | 1991 | Seattle |
| Fish, habitat | As watershed population density increased, there was a negative impact on urban fish and habitat | Couch, et al. | 1997 | Atlanta |
| Aquatic insects and fish | A comparison of three stream types found urban streams had lowest diversity and richness | Crawford & Lenat | 1989 | North Carolina |
| Stream temperature | Stream temperature increased directly with subwatershed impervious cover. | Galli | 1991 | Maryland |
| Aquatic insects | A significant decline in various indicators of wetland aquatic macroinvertebrate community health was observed as impervious cover increased to levels of 8-9%. | Hicks & Larson | 1997 | Connecticut |
| Insects, fish, habitat water quality, riparian zone | Steepest decline of biological functioning after 6% imperviousness. There was a steady decline, with approx 50% of initial biotic integrity at 45% impervious area. | Horner, et al. | 1996 | Puget Sound
Washington |
| Aquatic insects and fish | Unable to show improvements at 8 sites downstream of BMPs as compared to reference conditions. | Jones, et al. | 1996 | Northern Virginia |
| Aquatic insects | Urban streams had sharply lower insect diversity with human population above 4/acre. (About 10%) | Jones & Clark | 1987 | Northern Virginia |
| Aquatic insects & fish | Macroinvertebrate and fish diversity decline significantly beyond 10-12% impervious area. | Klein | 1979 | Maryland |
| Aquatic insects | Drop in insect taxa from 13 to 4 noted in urban streams. | Garie and McIntosh | 1986 | New Jersey |
| Fish spawning | Resident and anadromous fish eggs & larvae declined in 16 streams with > 10% impervious area. | Limburg & Schmidt | 1990 | New York |
| Fish | Shift from less tolerant coho salmon to more tolerant cutthroat trout pop.-between 10-15% impervious area at 9 sites. | Luchetti & Fuersteburg | 1993 | Seattle |
| Stream channel stability | Urban stream channels often enlarge their cross-sectional area by a factor of 2 to 5. Enlargement begins at relatively low levels of impervious cover. | MacRae | 1996 | British Columbia |
| Aquatic insects & stream habitat | No significant difference in biological and physical metrics for 8 BMP sites versus 31 sites without BMPs (with varying impervious area). | Maxted and Shaver | 1996 | Delaware |
| Insects, fish, habitat, water quality, riparian zone | Physical and biological stream indicators declined most rapidly during the initial phase of the urbanization process as the percentage of total impervious area exceeded the 5-10% range. | May, et al. | 1997 | Washington |
| Aquatic insects and fish | There was significant decline in the diversity of aquatic insects and fish at 10% impervious cover. | MWCOG | 1992 | Washington, DC |
| Aquatic insects | As watershed development levels increased, the macroinvertebrate community diversity decreased. | Richards, et al. | 1993 | Minnesota |
| Aquatic insects | Biotic integrity decreases with increasing urbanization in study involving 209 sites, with a sharp decline at 10% I. Riparian condition helps mitigate effects. | Steedmen | 1988 | Ontario |
| Wetland plants, amphibians | Mean annual water fluctuation inversely correlated to plant & amphibian density in urban wetlands. Declines noted beyond 10% impervious area. | Taylor | 1993 | Seattle |
| Wetland water quality | There is a significant increase in water level fluctuation, conductivity, fecal coliform bacteria, and total phosphorus in urban wetlands as impervious cover exceeds 3.5%. | Taylor, et al. | 1995 | Washington |
| Sediment loads | About 2/3 of sediment delivered into urban streams comes from channel erosion. | Trimble | 1997 | California |
| Water quality-pollutant conc. | Annual P, N, COD, & metal loads increased in direct proportion with increasing impervious area. | US EPA | 1983 | National |
| Fish | As watershed development increased to about 10%, fish communities simplified to more habitat and trophic generalists. | Weaver | 1991 | Virginia |
| Aquatic insects & fish | All 40 urban sites sampled had fair to very poor index of biotic integrity (IBI) scores, compared to undeveloped reference sites. | Yoder | 1991 | Ohio |
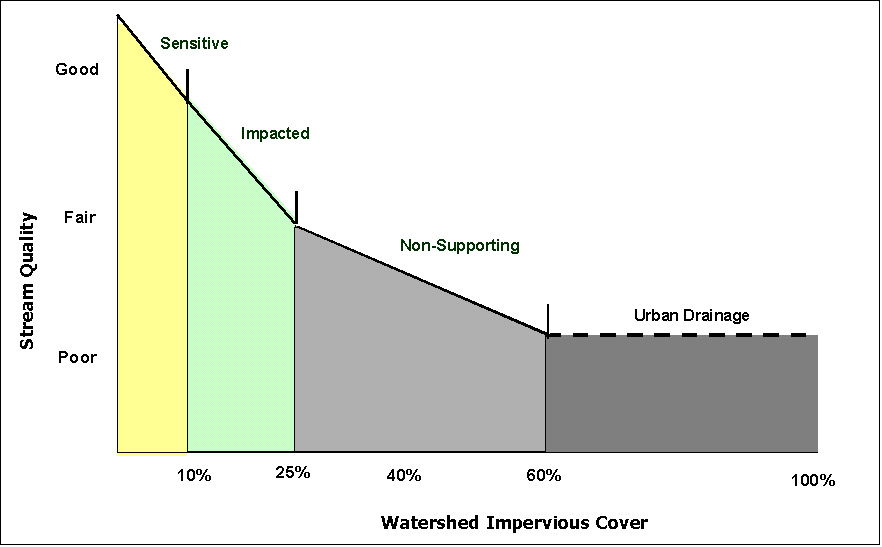
Taking all the research together, it is possible to construct a simple urban stream classification scheme based on impervious cover and stream quality. This simple classification system contains three stream categories, based on the percentage of impervious cover. Figure 1 illustrates this simple, yet powerful model that predicts the existing and future quality of streams based on the measurable change in impervious cover.
The model classifies streams into one of three categories: sensitive, impacted, and non-supporting. Each stream category can be expected to have unique characteristics as follows:
Sensitive Streams. These streams typically have a watershed impervious cover of zero to 10 percent. Consequently, sensitive streams are of high quality, and are typified by stable channels, excellent habitat structure, good to excellent water quality, and diverse communities of both fish and aquatic insects. Since impervious cover is so low, they do not experience frequent flooding and other hydrological changes that accompany urbanization. It should be noted that some sensitive streams located in rural areas may have been impacted by prior poor grazing and cropping practices that may have severely altered the riparian zone, and consequently, may not have all the properties of a sensitive stream. Once riparian management improves, however these streams are often expected to recover.
Impacted Streams. Streams in this category possess a watershed impervious cover ranging from 11 to 25 percent, and show clear signs of degradation due to watershed urbanization. The elevated storm flows begin to alter stream geometry. Both erosion and channel widening are clearly evident. Streams banks become unstable, and physical habitat in the stream declines noticeably. Stream water quality shifts into the fair/good category during both storms and dry weather periods. Stream biodiversity declines to fair levels, with most sensitive fish and aquatic insects disappearing from the stream.
Non-Supporting Streams. Once watershed impervious cover exceeds 25%, stream quality crosses a second threshold. Streams in this category essentially become conduits for conveying stormwater flows, and can no longer support a diverse stream community. The stream channel becomes highly unstable, and many stream reaches experience severe widening, downcutting, and streambank erosion. Pool and riffle structure needed to sustain fish is diminished or eliminated and the substrate can no longer provide habitat for aquatic insects, or spawning areas for fish. Water quality is consistently rated as fair to poor, and water recreation is no longer possible due to the presence of high bacterial levels. Subwatersheds in the non-supporting category will generally display increases in nutrient loads to downstream receiving waters, even if effective urban BMPs are installed and maintained. The biological quality of non-supporting streams is generally considered poor, and is dominated by pollution tolerant insects and fish.
Although the impervious cover model is supported by research, its assumptions and limitations need to be clearly understood. There are some technical issues involved in its development which are discussed below:
Limitations of the Impervious Cover Model
1. Scale effect. The impervious cover model should generally only be applied to smaller urban streams from first to third order. This limitation reflects the fact that most of the research has been conducted at the catchment or subwatershed level (0.2 to 10 square mile area), and that the influence of impervious cover is strongest at these spatial scales. In larger watersheds and basins, other land uses, pollution sources and disturbances often dominate the quality and dynamics of streams and rivers.
2. Reference condition. The simple model predicts potential rather than actual stream quality. Thus, the reference condition for a sensitive stream is a high quality, non-impacted stream within a given ecoregion or sub-ecoregion. It can and should be expected that some individual stream reaches or segments will depart from the predictions of the impervious cover model. For example, physical and biological monitoring may find poor quality in a stream classified as sensitive, or good diversity in a non-supporting one. Rather than being a shortcoming, these "outliers" may help watershed managers better understand local watershed and stream dynamics. For example, an "outlier" stream may be a result of past human disturbance, such as grazing, channelization, acid mine drainage, agricultural drainage, poor forestry practices, or irrigation return flows.
3. Statistical variability. Individual impervious cover/stream quality indicator relationships tend to exhibit a considerable amount of scatter, although they do show a general trend downward as impervious cover increases. Thus, the impervious cover model is not intended to predict the precise score of an individual stream quality indicator for a given level of impervious cover. Instead, the model attempts to predict the average behavior of a group of stream indicators over a range of impervious cover. In addition, the impervious cover thresholds defined by the model are not sharp breakpoints, but instead reflect the expected transition of a composite of individual stream indicators.
4. Measuring and projecting impervious cover. Given the central importance of impervious cover to the model, it is very important that it be accurately measured and projected. Yet comparatively relatively little attention has been paid to standardizing techniques for measuring existing impervious cover, or forecasting future impervious cover. Some investigators define impervious cover as "effective impervious area" (i.e., impervious area not directly connected to a stream or drainage system) which may be lower than total impervious cover under certain suburban or exurban development patterns (Sutherland, 1995).
5. Regional adaptability. To date, much research used to develop the model has been performed in the mid-Atlantic and Puget Sound eco-regions. In particular, very little research has been conducted in western, midwestern, or mountainous streams. Further research is needed to determine if the impervious cover model applies in these ecoregions and terrains.
6. Defining thresholds for non-supporting streams. Most research has focused on the transition from sensitive streams to impacted ones. Much less is known about the the nature of the transition from impacted streams to non-supporting ones. The impervious cover model projects the transition occurs around 25% impervious cover for small urban streams, but more sampling is needed to firmly establish this threshold.
7. Influence of BMPs in extending thresholds. Urban BMPs may be able to shift the impervious cover thresholds higher. The ability of the current generation of urban BMPs to shift these thresholds however, appears to be very modest according to several lines of evidence. First, a handful of the impervious cover/stream indicator research studies were conducted in localities that had some kind of requirements for urban best management practices; yet no significant improvement in stream quality was detected. Second, Maxted and Shaver (1996) and Jones, et al. (1996) could not detect an improvement in bioassessment scores in streams served by stormwater ponds.
8. Influence of riparian cover in extending thresholds. Conserving or restoring an intact and forested riparian zone along urban streams appears to extend the impervious cover threshold to a modest degree. For example, Steedman (1988) found that forested riparian stream zones in Ontario had higher habitat and diversity scores for the same degree of urbanization than streams that lacked an intact riparian zone. Horner, et al. (1996) also found evidence of a similar relationship. This is not surprising, given the integral role the riparian zone plays in the ecology and morphology of headwater streams. Indeed, the value of conserving and restoring riparian forests to protect stream ecosystems is increasingly being recognized as a critical management tool in rural and agricultural landscapes as well (CBP, 1995).
9. Potential for stream restoration. Streams classified by their potential for restoration (also known as restorable streams) offer opportunities for real improvement in water quality, stability, or biodiversity and hydrologic regimes through the use of stream restoration, urban retrofit and other restoration techniques.
10. Pervious areas. An implicit assumption of the impervious cover model is that pervious areas in the urban landscape do not matter much, and have little direct influence on stream quality. Yet urban pervious areas are highly disturbed, and possess few of the qualities associated with similar pervious cover types situated in non-urban areas. For example, it has recently been estimated that high input turf can comprise up to half the total pervious area in suburban areas (Schueler, 1995a). These lawns receive high inputs of fertilizers, pesticides and irrigation, and their surface soils are highly compacted.
Although strong links between high input turf and stream quality have yet to be convincingly demonstrated, watershed planners should not neglect the management of pervious areas. Pervious areas also provide opportunities to capture and store runoff generated from impervious areas. Examples include directing rooftop runoff over yards, the use of swales and filter strips, and grading impervious areas to pockets of pervious area. When pervious and impervious areas are integrated closely together, it is possible to sharply reduce the "effective" impervious area in the landscape (Southerland, 1995).
While there are some limitations to the application of the urban stream impervious cover model, impervious cover still provides us with one of the best tools for evaluating the health of a subwatershed. Impervious cover serves not only as an indicator of urban stream quality but also as a valuable management tool in reducing the cumulative impacts of development within subwatersheds.